Diagrams
Diagrams are created using React Flow.
Create a src/vision/viewpoints/diagrams directory (case-sensitive)
The src/vision/viewpoints/diagrams directory is responsible for:
- Defining what OML Vision Diagrams can render
- Name of the Diagrams
- Name of the nodes for the Diagram
- Name of the edges for the Diagram
- Queries for the Diagram node content
- Queries for the Diagram edge content
- How to map Diagrams node queries to edge queries
Each file in the directory is formatted as a JSON data structure.
An example of what this looks like is seen below with the source code found here
Defining A Diagram
A Diagram must be properly defined in order to be rendered by OML Vision.
The following are JSON key-value pairs that can be defined for a Diagram.
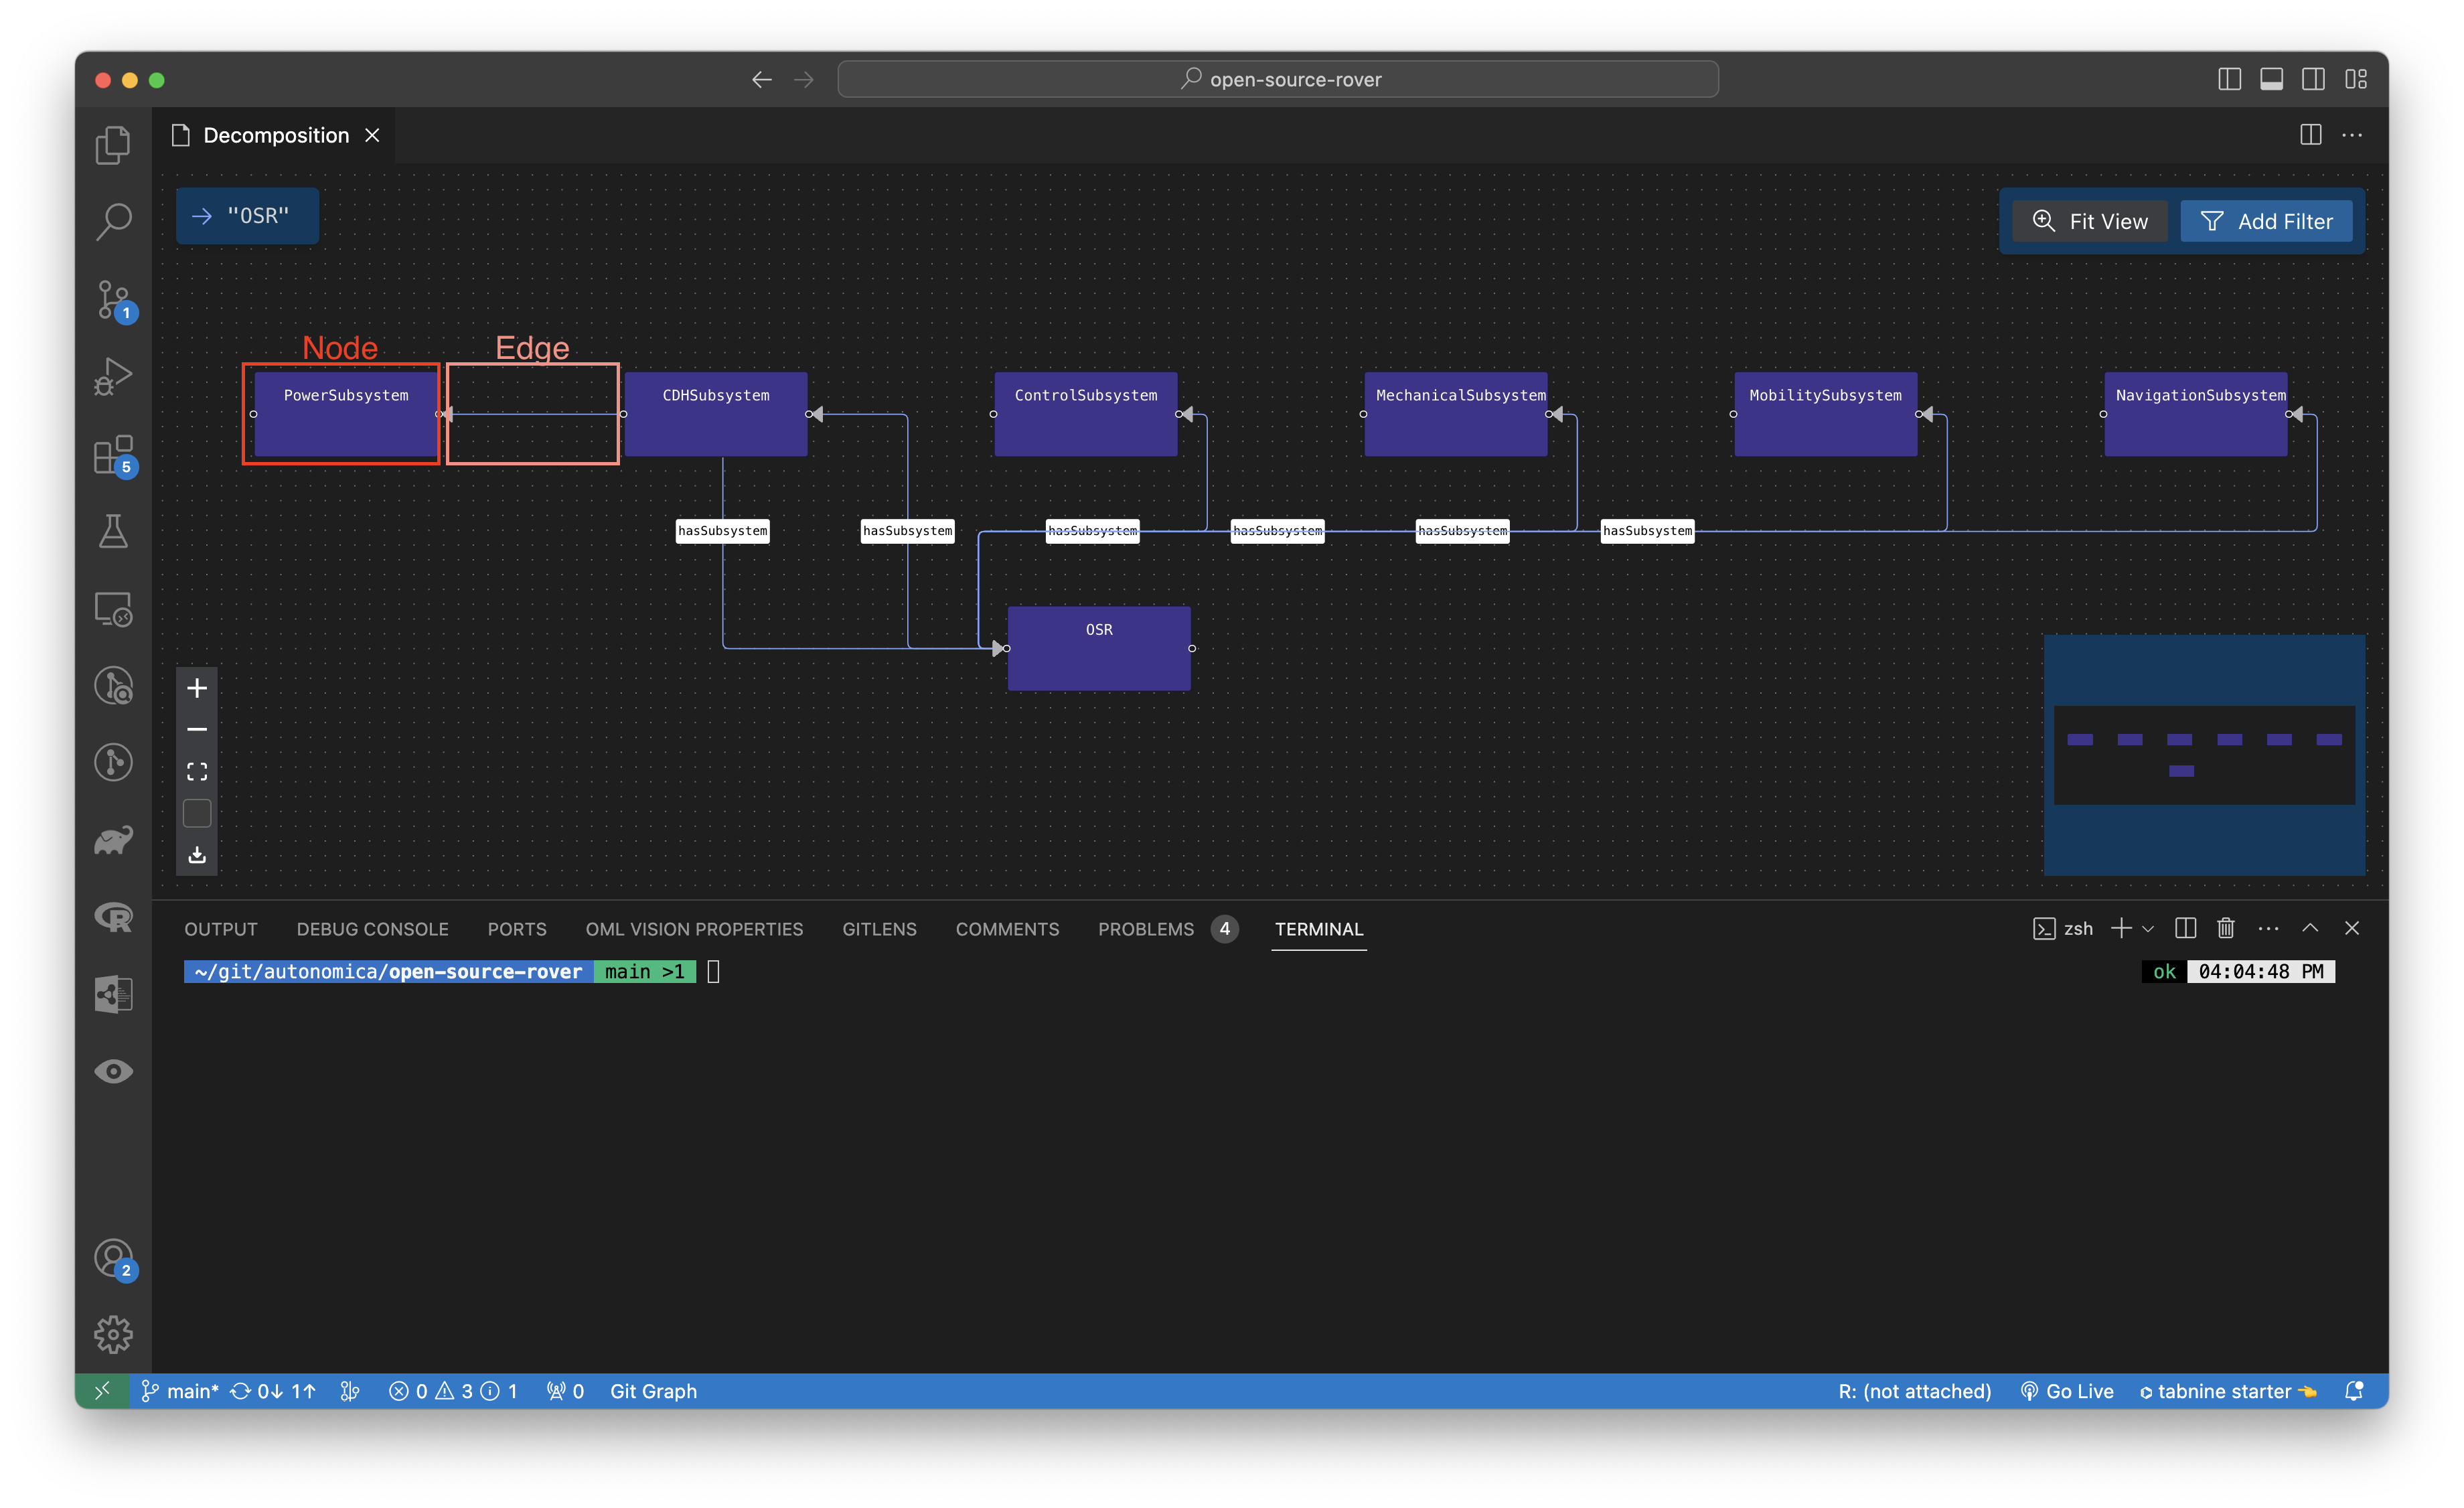
Terminology
OML Vision defines a node and edge as follows:
- Node: A graphical element that contains information
- Edge: A graphical element that connects information
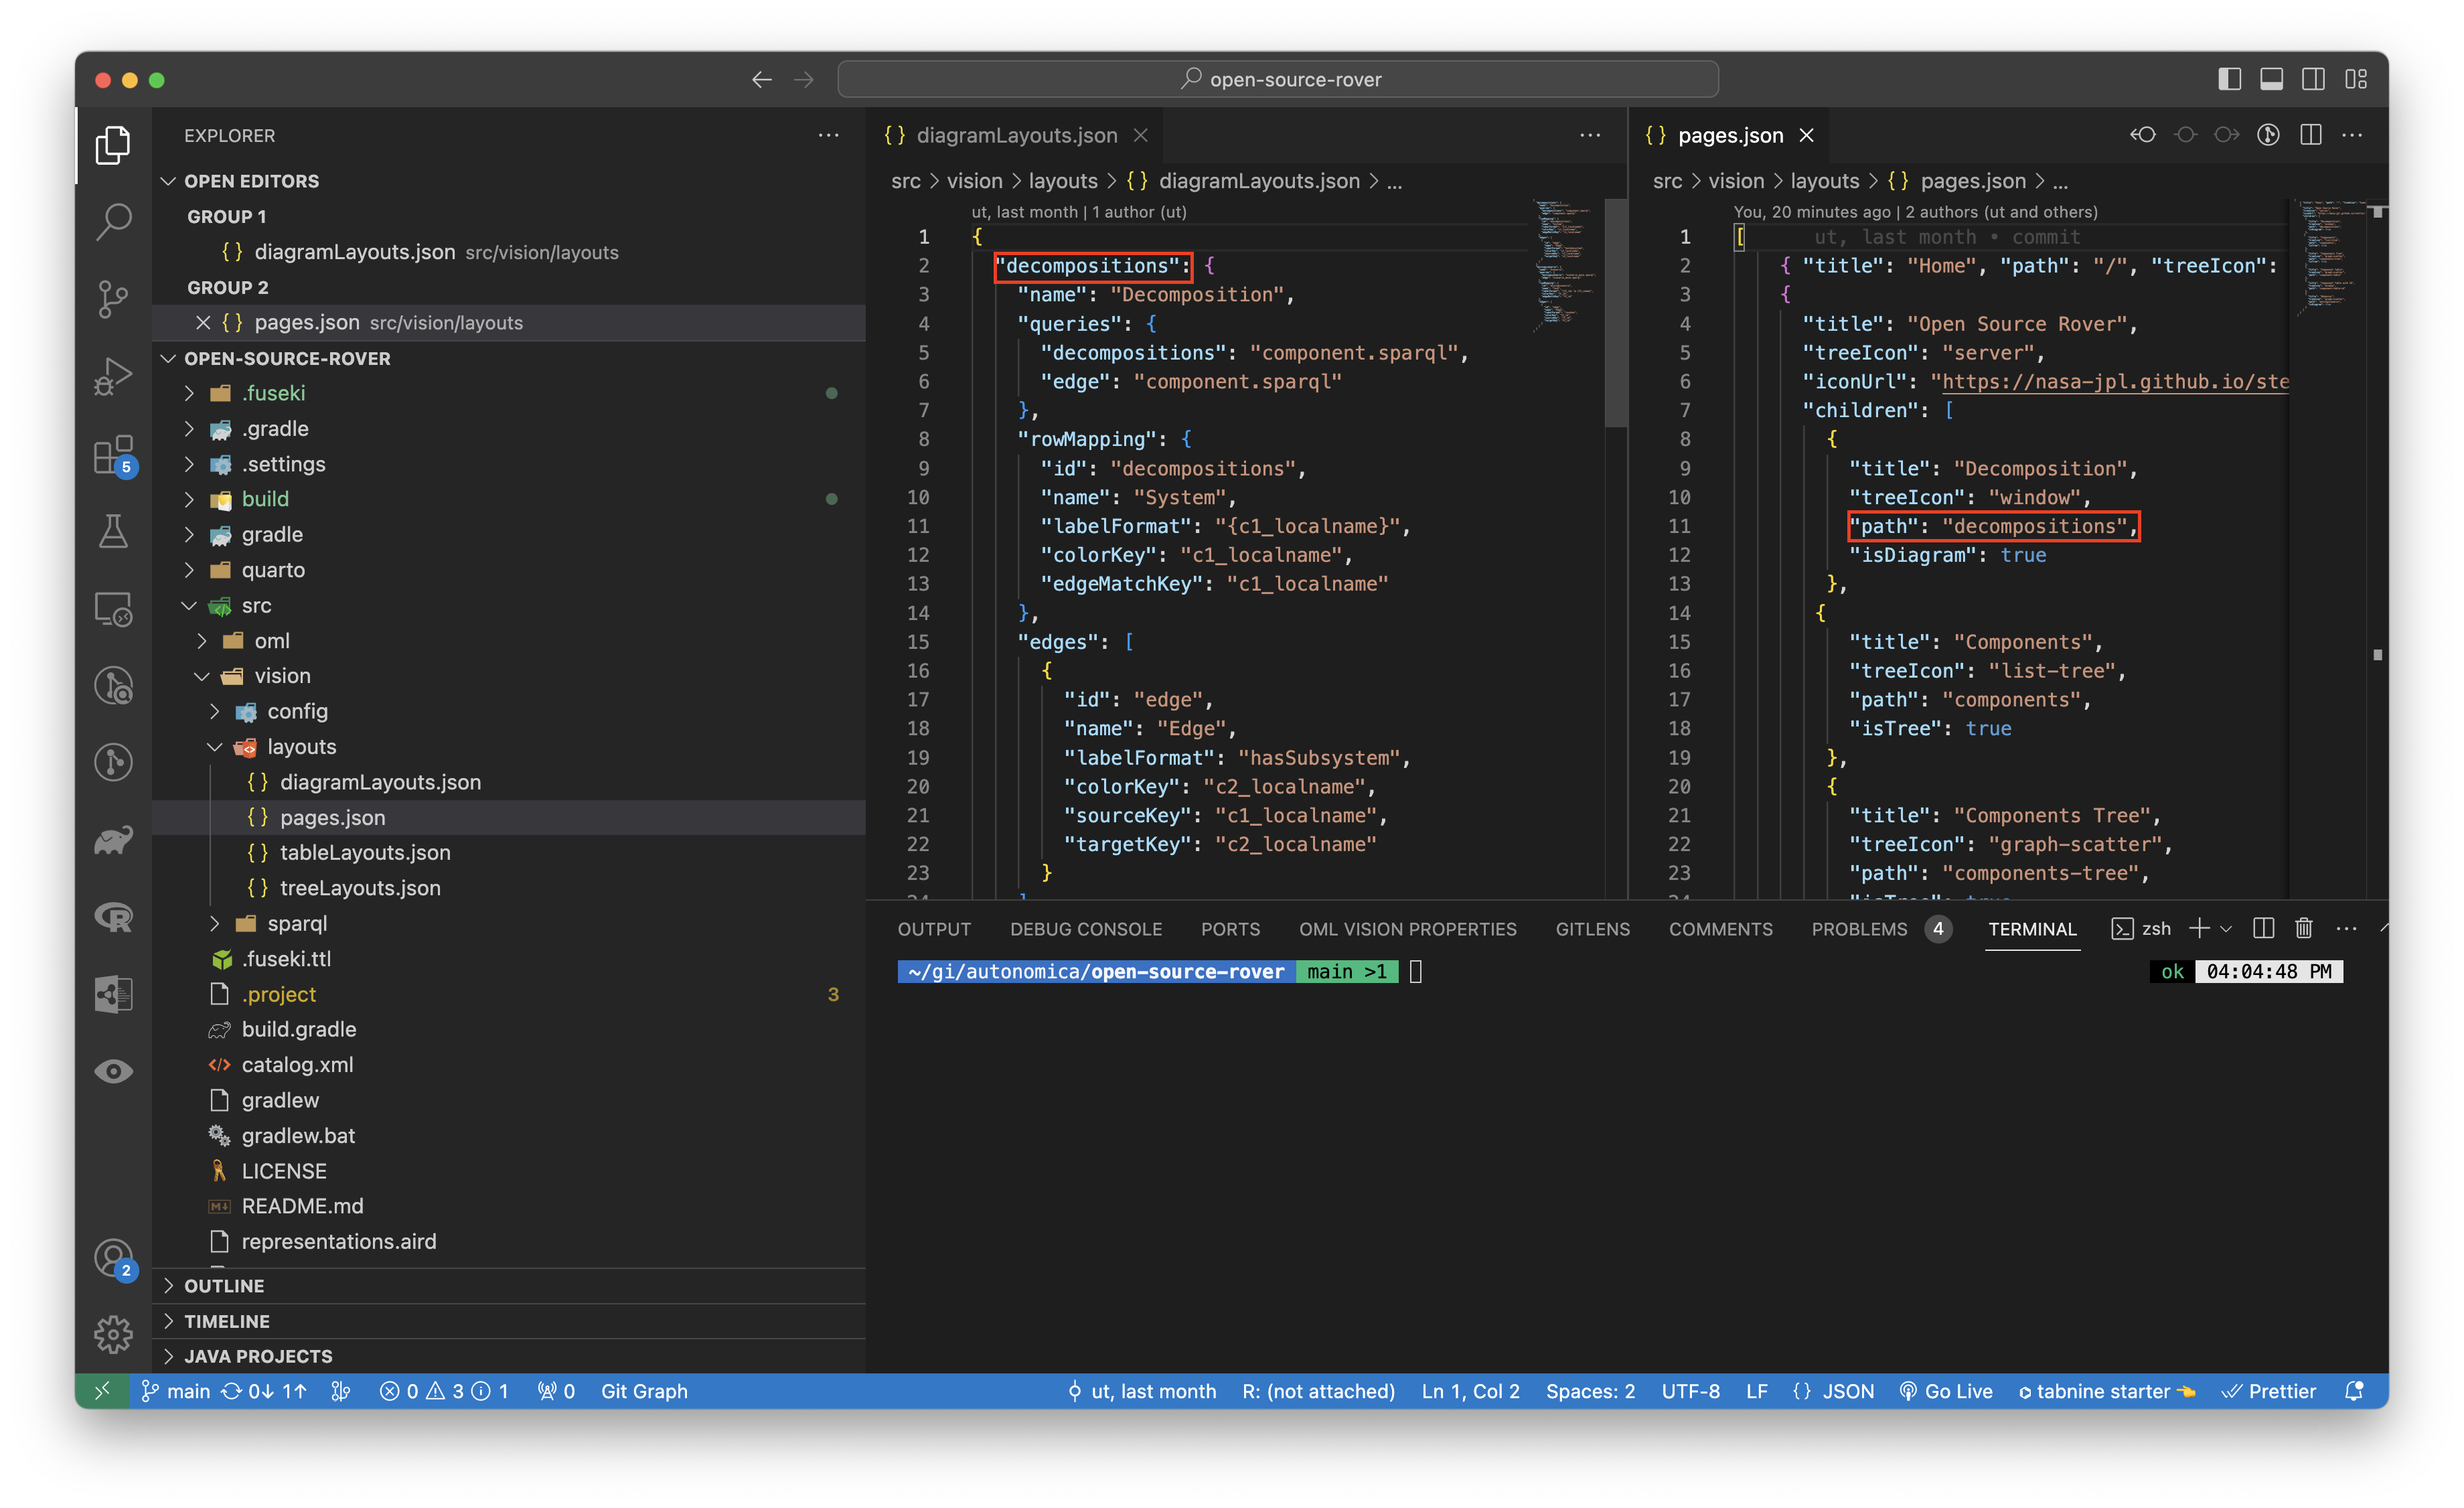
path
path: string
This string defines the path of the Diagram.
The name of the path is the same path that was defined in the pages.json.
name
name: string
This string gives a name to the Diagram.
queries
queries: {}
This object contains the queries that will query the RDF Triplestore for the content that will populate in the Diagram.
Look at the sparql docs for more info found here
You can test queries by going to localhost:3030 which is created once data is loaded into the Fuseki DB. You can watch more info about testing queries with Fuseki by going here
The AI & DS Channel (2021, February 18). SPARQL Query [Video]. YouTube. https://www.youtube.com/watch?v=w_pJ3XiBWeM&t=621s
rowMapping
rowMapping: {
  id: connections
  name: string
  labelFormat: string
  nodeColor: string
  nodeTextColor: string
  nodeType: string
  edgeMatchKey: string
}
This object defines how the queries map to the columnNames
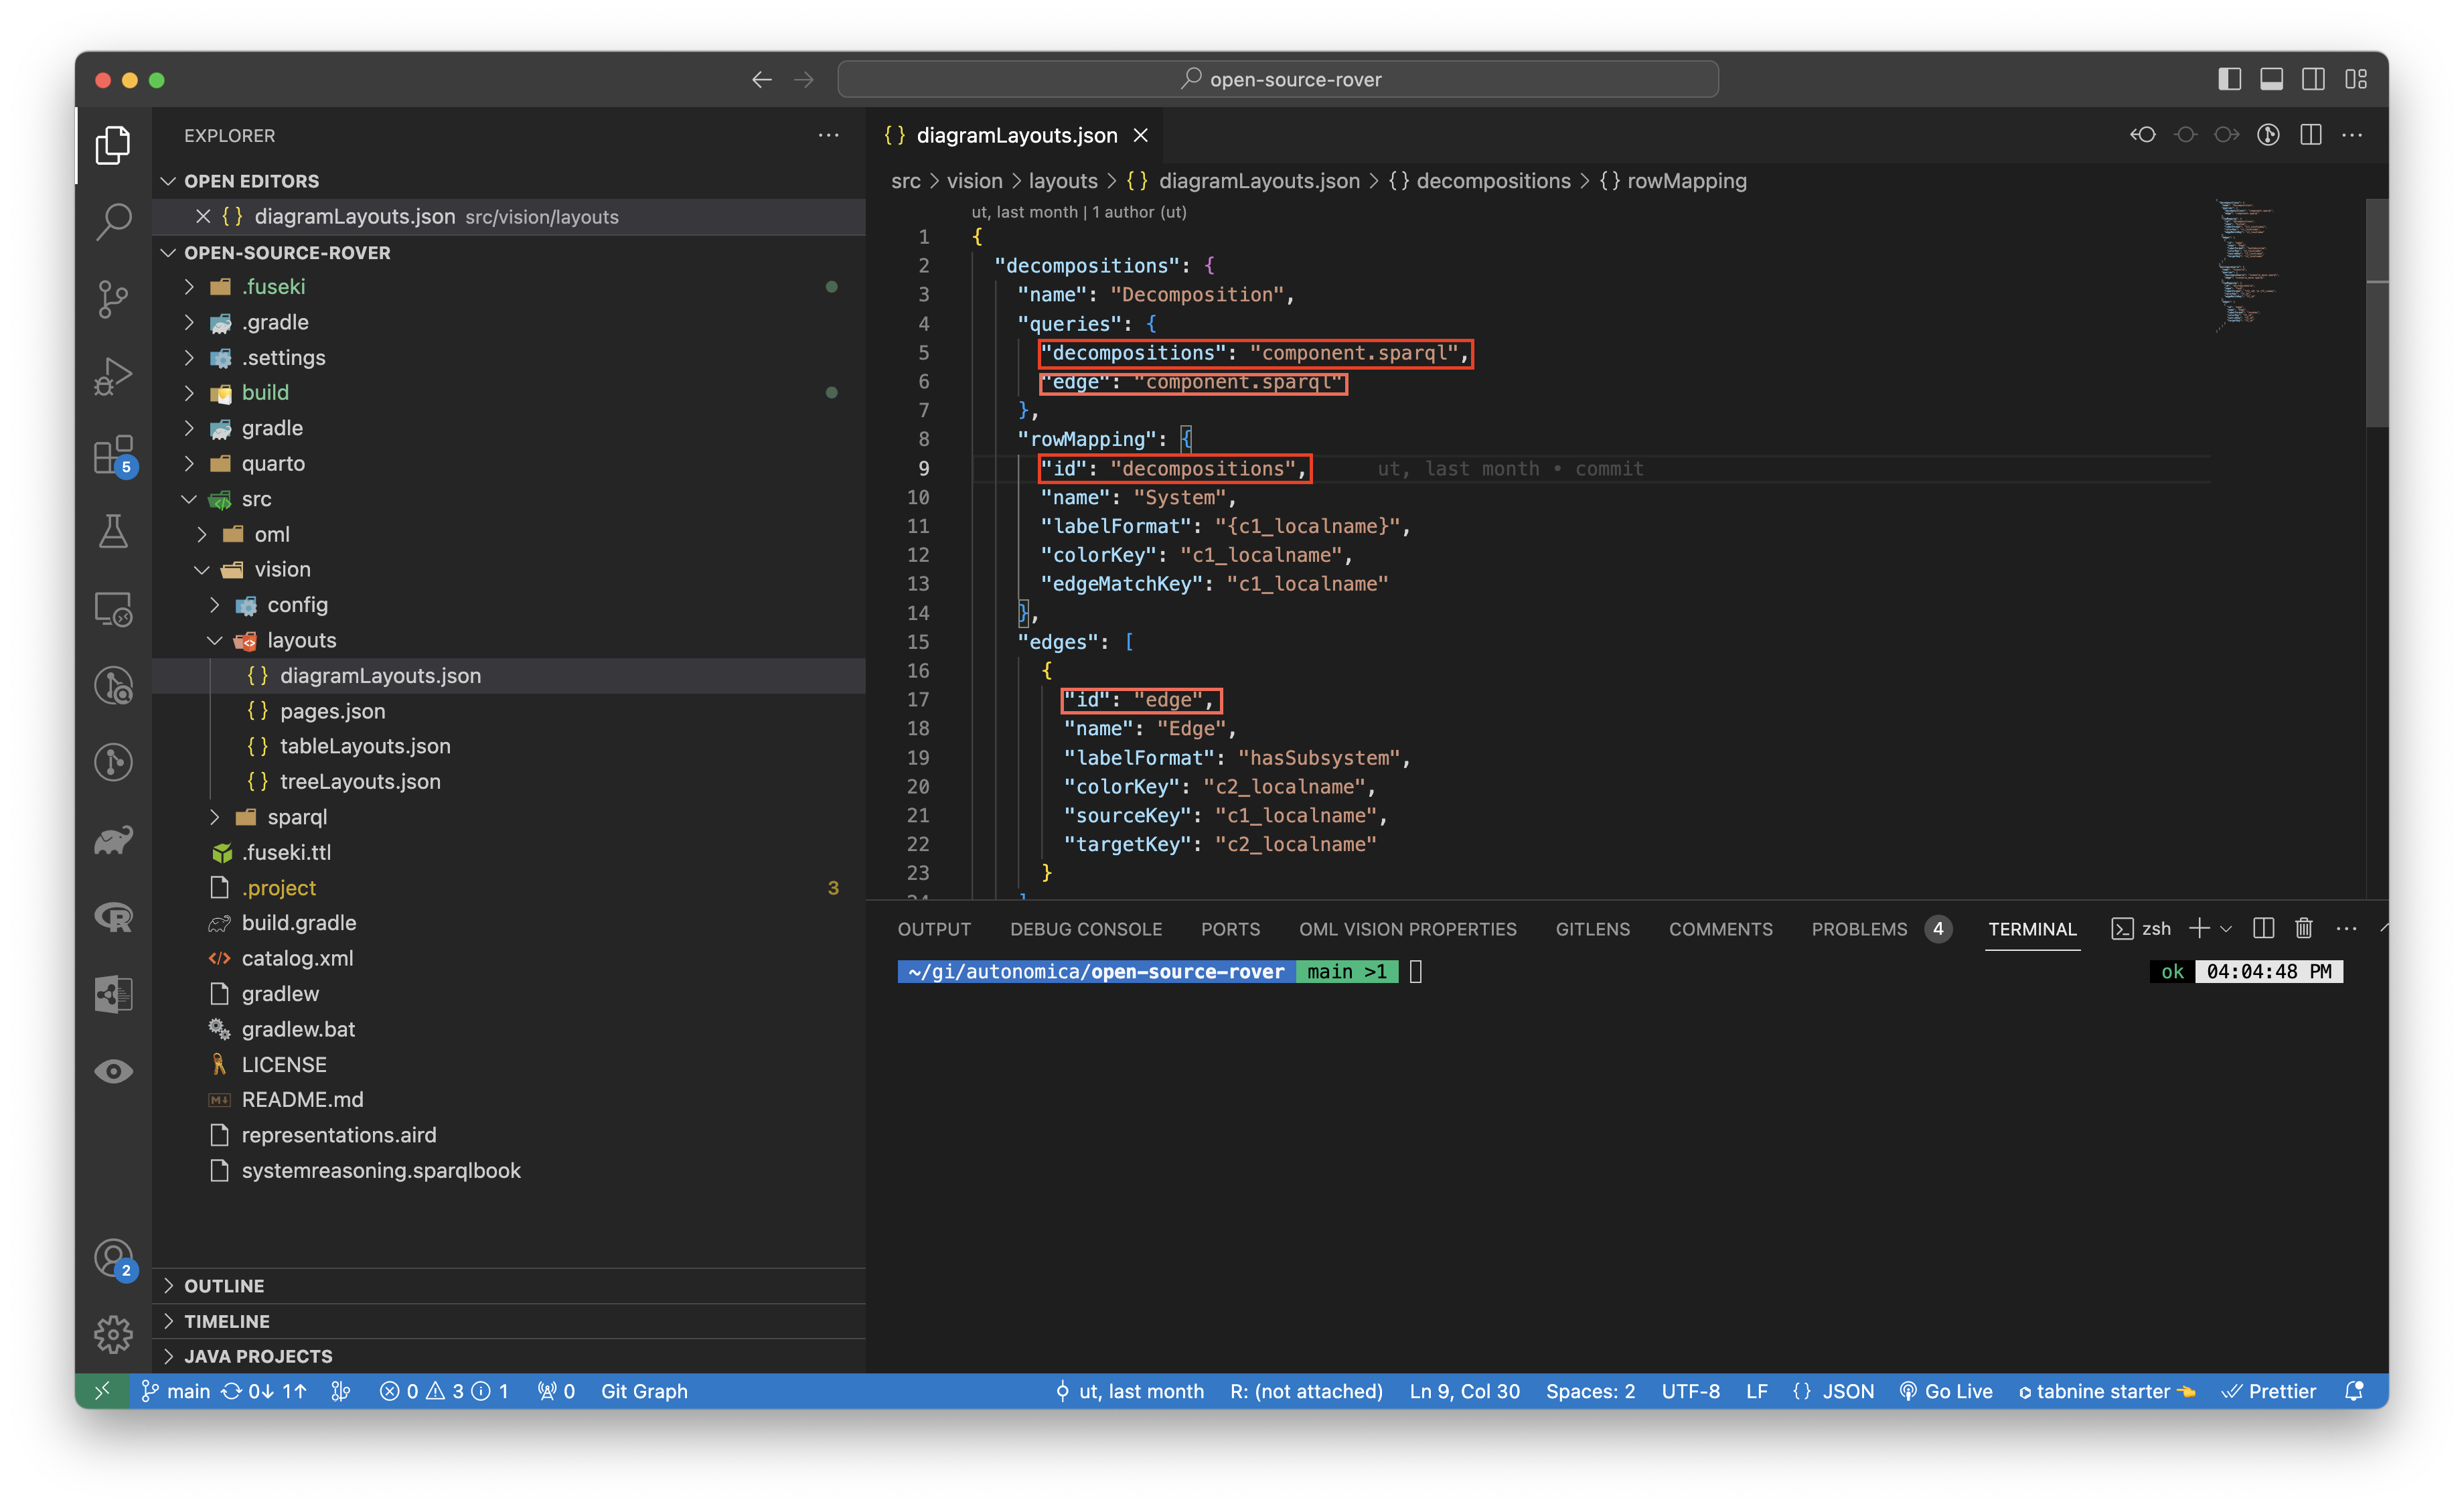
id
id: string
This string the id for the rowMapping.
The id correspond to one of the columnNames.
name
name: string
This string gives a name to the rowMapping.
labelFormat
labelFormat: string
This string contains the label of the row for the rowMapping.
The labelFormat is rendered in the rows of the Diagram shown in the red boxes.
STRING INTERPOLATION
OML Vision supports string interpolation with the queries that were formatted. The format is "{string}". Please visit the sparql section of the documentation for more info located here
An example is found here

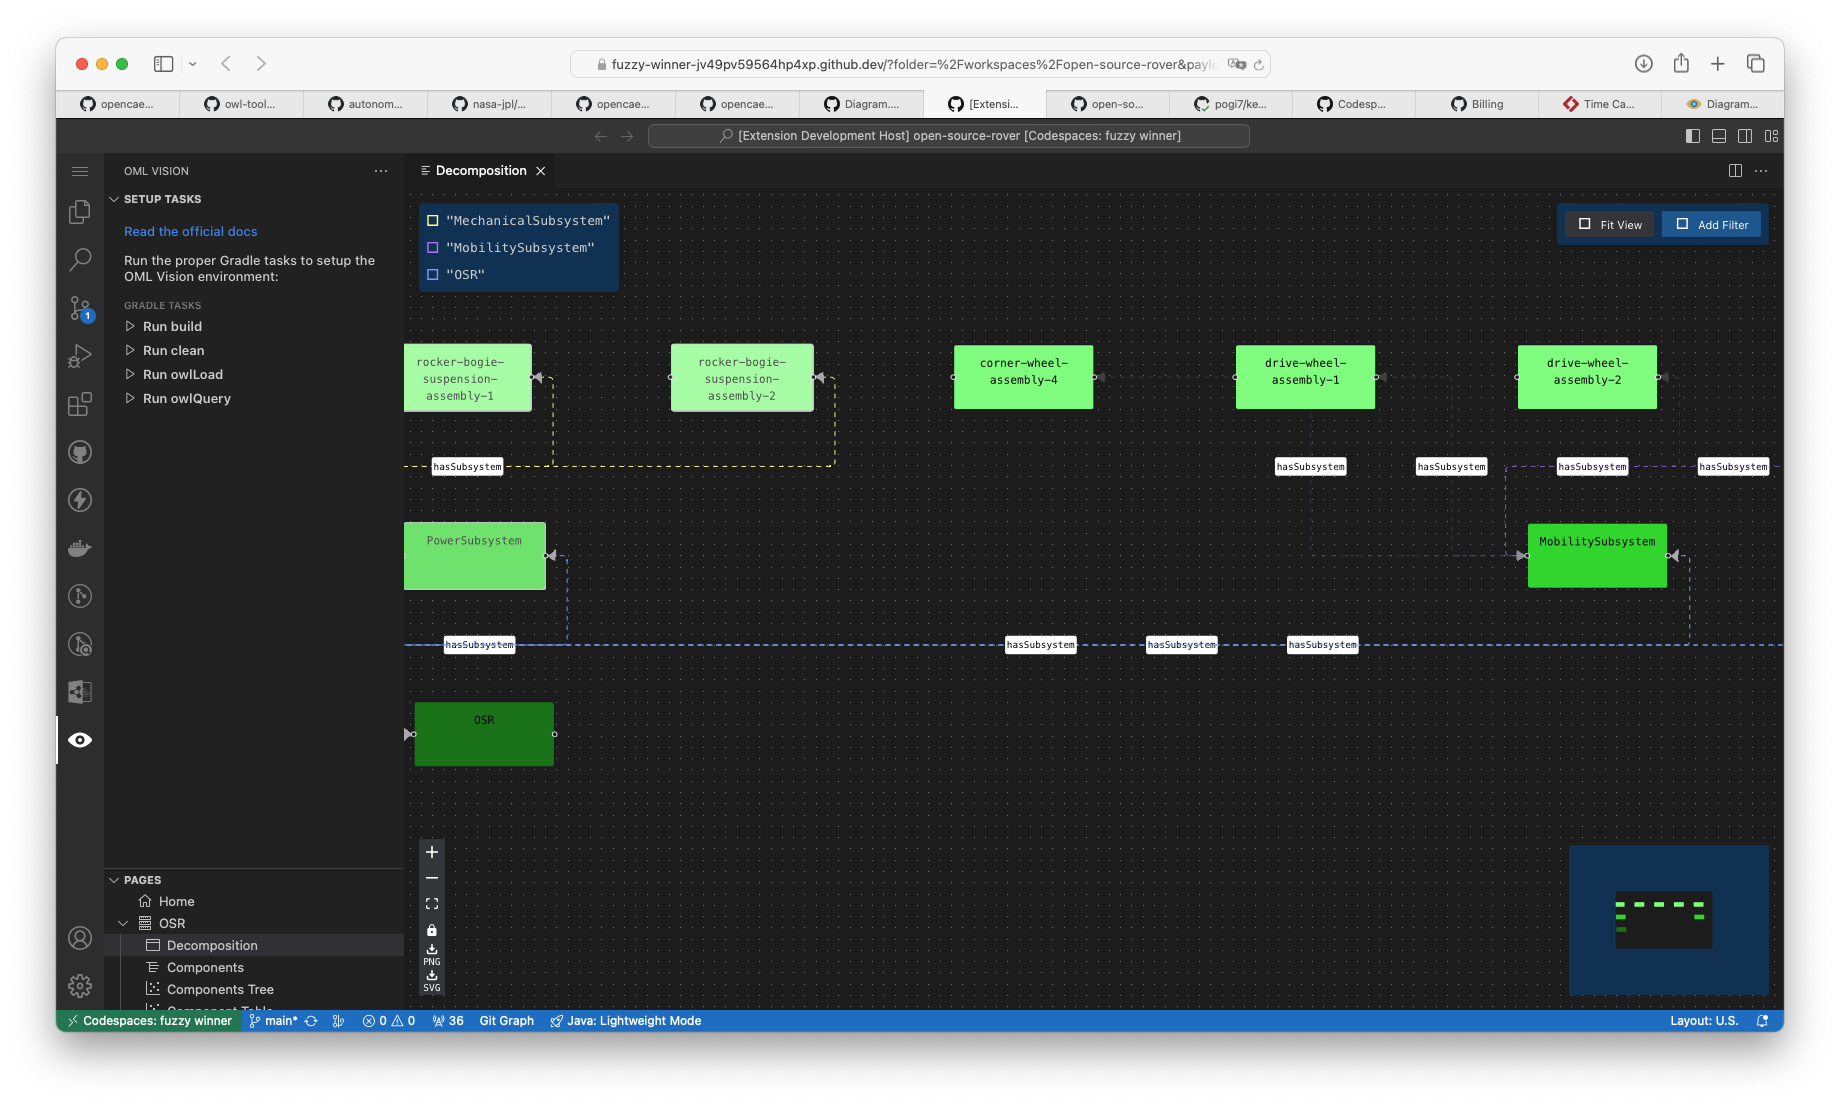
nodeColor
nodeColor: string
This string sets the color of the nodes rendered in the Diagram. Users can pick from a wide array of colors. The full list is here
Non Case Sensitive Spelling
OML vision is smart enough to understand inputting the name of the color or the hex value. These inputs are not case sensitive.
Inputting green, GREEN, Green, or #00ff00 will all output the color green to the nodes in the diagram view.
nodeTextColor
nodeTextColor: string
This string sets the color of the text within the nodes rendered in the Diagram. Users can pick from a wide array of colors. The full list is here
Non Case Sensitive Spelling
OML vision is smart enough to understand inputting the name of the color or the hex value. These inputs are not case sensitive.
Inputting green, GREEN, Green, or #00ff00 will all output the color green to the text of the nodes in the diagram view.
nodeType
nodeTextColor: string
This string sets the type of node in the diagram view.
OML Vision colors nodes which are of type "Assembly" and "Subsystem" differently than other nodes.
The "Subsystem" node is automatically darkened relative to the nodeColor.
The "Assembly" node is automatically lightened relative to the nodeColor.
For an example of how these nodes are queried and configured look at the following example located here
STRING INTERPOLATION
OML Vision supports string interpolation with the queries that were formatted. The format is "{string}". Please visit the sparql section of the documentation for more info located here
edgeMatchKey
edgeMatchKey: string
This string defines the edge for each node in the Diagram.
STRING INTERPOLATION
OML Vision supports string interpolation with the queries that were formatted. The format is "{string}". Please visit the sparql section of the documentation for more info located here
subRowMappings
subRowMappings: {
    id: string
    name: string
    labelFormat: string
    nodeColor: string
    nodeTextColor: string
    nodeType: string
    edgeMatchKey: string
  }[]
This subRowMappings array of objects defines the id, name, labelFormat, nodeColor, nodeTextColor, nodeType, and edgeMatchKey for the subrows of the Diagram.
The id, name, labelFormat, nodeColor, nodeTextColor, nodeType, and edgeMatchKey have the same data structure as rowMapping
edges
edges: {
    id: string
    name: string
    animated: boolean
    labelFormat: string
    legendItems: string
    sourceKey: string
    targetKey: string
  }[]
This edges array of objects defines the id, name, animated, labelFormat, legendItems, sourceKey, and targetKey for the edges of the Diagram.
The id, name, and labelFormat have the same data structure as rowMapping
animated
animated: boolean
This boolean defines whether or not all edges in the Diagram are animated are not.
legendItems
legendItems: string
This string defines the items that are populated in the legend in the diagram. These items are automatically colored by OML Vision.
STRING INTERPOLATION
OML Vision supports string interpolation with the queries that were formatted. The format is "{string}". Please visit the sparql section of the documentation for more info located here
sourceKey
sourceKey: string
This string defines the source node for the edge in the Diagram.
targetKey
targetKey: string
This string defines the target node for the edge in the Diagram.
Abilities
Highlight Edges
Hightlight edges connected to nodes by clicking one or multiple nodes. You can select multiple nodes by holding down the CMD (macOS) or Ctrl (Windows) key.
No Node Highlight with unlighted edges:

Node Highlight with highlighted edges:
PNG Download
In the lower left of the diagram, you can click the PNG icon to download the current state of the diagram to a PNG image.
SVG Download
In the lower left of the diagram, you can click the SVG icon to download the current state of the diagram to a SVG file.
Lock/Unlock
In the lower left of the diagram, you can click the lock icon to unlock the nodes and edges in the diagram.
When the diagram is unlocked you can select one or multiple nodes to move around.
You can lock the nodes and edges in the diagram by clicking the unlock icon.
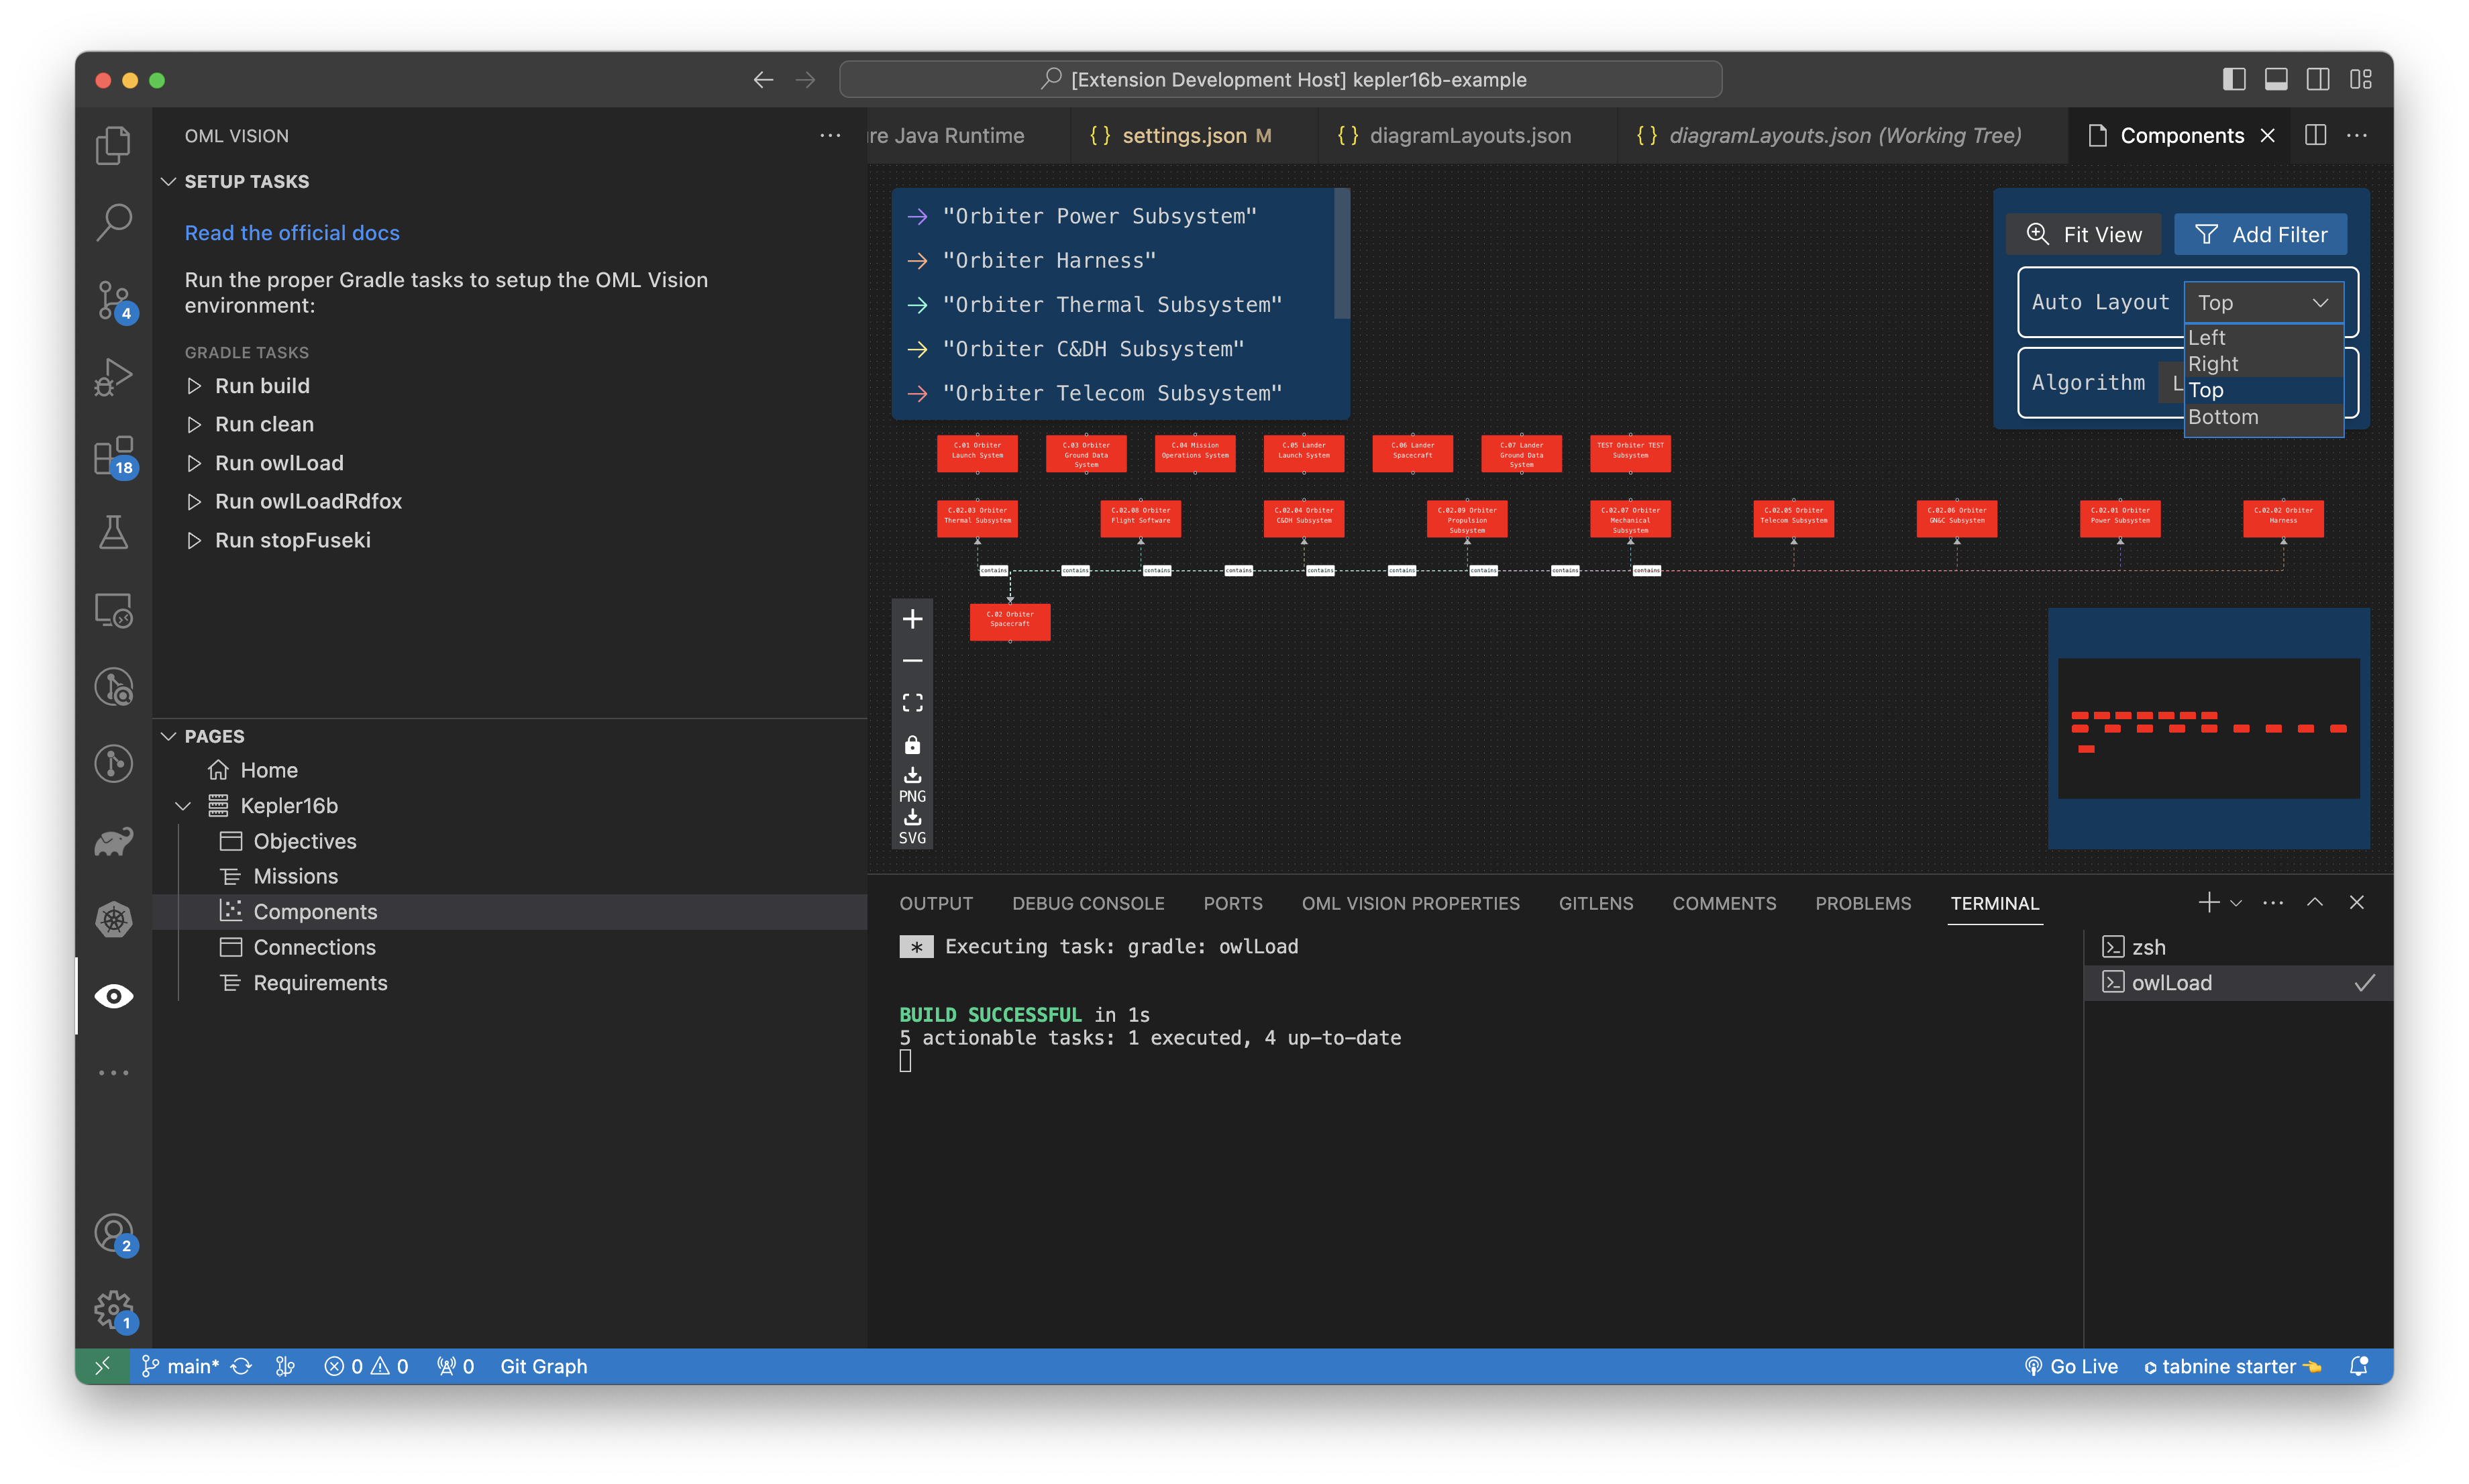
Change Node Layout Position
In the upper right of the diagram, you can click the Auto Layout dropdown to change the node position.
The position is based off of https://reactflow.dev/api-reference/types/position
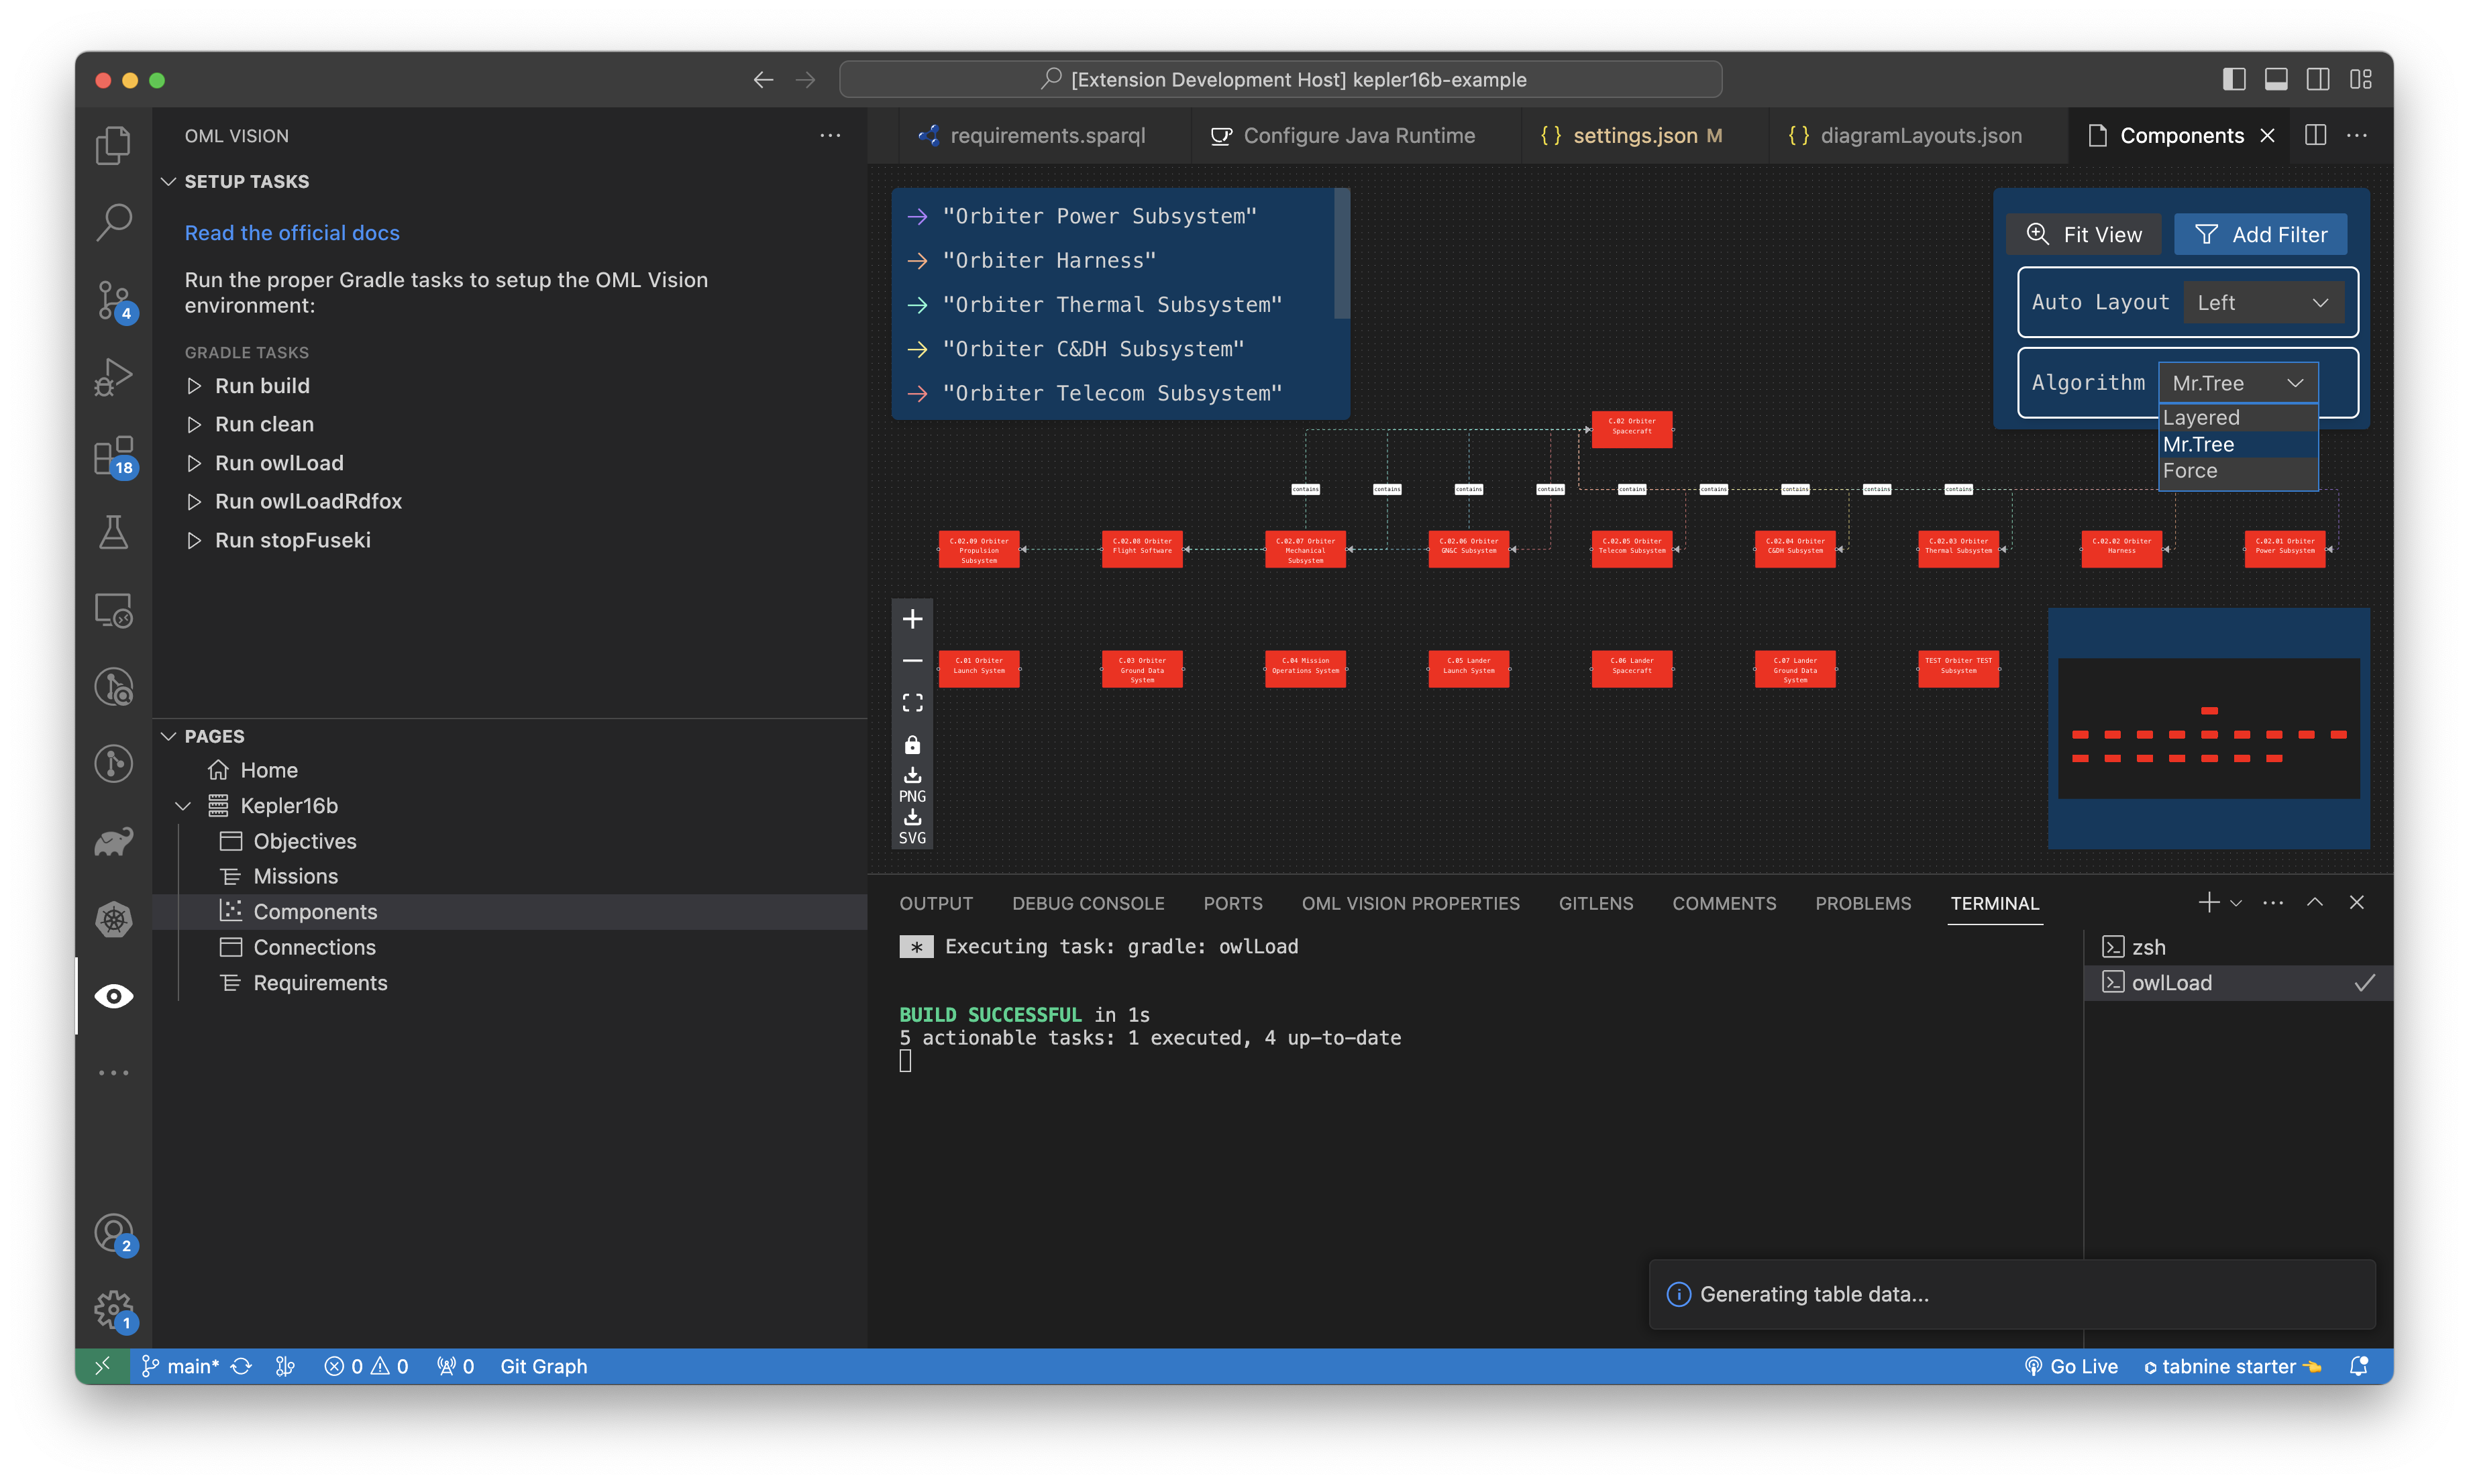
Change Algorithm Layout
In the upper right of the diagram, you can click the Algorithm dropdown to change the algorithm that is used to calculate the layout of the nodes and edges.
There are three available algorithms to select from:
Parent-Child Nodes
You can create a parent-child relationship between nodes that can be represented in a block diagram. This is done using a unique identifer called a IRI. The IRI is obtained from a SPARQL query. This SPARQL query specifies that a parent node contains one or more child blocks. The IRI of the child should be obtained with the ?iri key and the IRI of the parent should be specified with ?parentIri or a key ending with 'Iri'.
An example of how this is done can be found here